Libreswan Documentation

Libreswan's Online Documentation
View the Project on GitHub libreswan/libreswan.github.io
SupportHOWTO
Additional ipsec.conf documentationAWS Mesh
brendans Road Warrior Setup at Home
Configuration examples
Confuse !?@: github wiki
Enterprise cloud encryption
Entropy matters
EoIP shared ethernet LAN using IPsec
High Availability Fallover VPN in AWS
Host to host VPN
Host to host VPN with PSK
Libreswan as client to a Cisco ASA or VPN3000 server
Microsoft Azure configuration
Migrate from IKEv1 DPD to IKEv2 LIVENESS
Opportunistic IPsec
Opportunistic IPsec using LetsEncrypt
Pluto and DNSSEC
Read status output
Route based VPN
SElinux and Labeled IPsec VPN
Subnet extrusion
Subnet to subnet using NAT
Subnet to subnet VPN
Subnet to subnet VPN with PSK
Unauthenticated Opportunistic IPsec
Using Apache to serve PKCS
Using NSS Hardware Tokens
Using NSS with libreswan
VPN server for remote clients using IKEv2
VPN server for remote clients using IKEv2 split VPN
Completed Projects
2026 RFC 9593 Announcing Supported Authentication Methods in IKEv22026 Improve the ACQUIRE to IKE policy lookup
2026 Add HOST TO HOST Support on BSD
2021 RFC 8420 Add EdDSA Signature Authentication Support to IKEv2
2020 Session Resumption
2020 IKEv2 Interop testing with OpenBSD
2020 IKE Intermediate Exchange
2019 Libreswan Opportunistic IPsec using LetsEncrypt
2018 RSA PSS Support in compliance with RFC 7427 and RFC 8247
2018 RFC 7427 Add ECDSA Signature Authentication Support to IKEv2
2018 RFC 5685 Redirect Mechanism
2018 Managing Interface
2017 TCP encapsulation of IKE and IPsec
2017 RFC 7427 Add Signature Authentication Support to IKEv2
2017 Postquantum Preshared Keys
IRC
Hacking
DocumentationGit, GitHub, and Pull Requests
Merging GitHub Pull Requests
Programming Conventions
Testing
DockerKVM
1. Setup The Host2. Configure Testing
3. Compile Libreswan
4. Test Libreswan
5. Accessing The Console
6. Maintenance and Internals
Bisecting
Debugging Pluto
Logging In Using SSH
Performance
Running A Custom Kernel
Running A Single Test
Running In The Background
Setup a Web Server
Testing Old Branches
Updating Test Results
Namespaces
Topology
Internals
3.14 X509Benchmarking and Performance testing
Cipher suites and algorithm support
Cloud OE ideas
Compiling with AddressSanitizer
Compliance of RFC 7427 Signature Authentication in IKEv2
Coverity
Cryptographic Acceleration
Developer links strongswan android
Discouraged or forbidden C functions
IKEv2 Child SA
IKEv2 CP and EAP support
Introduction
Libreswan xfrm kernel support
Logging cleanup
New OE
Pluto
Pluto packet processing
Proposed ipsec ca command
Retransmit timings
Road Map
SAref code
Setting up system for debug logging
stf status
Testing 2017 Next Generation
Unbound
Uncrustify
Use Cases and Requirements document for ECC ECDSA support
Use Cases and Requirements document
XFRM Interface Development Notes
XFRM pCPU
XFRM pCPU RSS
Security
Crypto boundary and certificationLibreswan and Heartbleed
Libreswan and TunnelCrack
Reporting a Vulnerability
Vulnerabilities
Obsolete HOWTOs
IKEv1 XAUTH with FreeOTP and FreeIPAIKEv1 XAUTH with Google Authenticator One Time Passwords
Route based VPN using VTI
Testing Namespace
VPN server for remote clients using IKEv1 with L2TP
VPN server for remote clients using IKEv1 XAUTH with Certificates
VPN server for remote clients using IKEv1 XAUTH with PSK
To make the KVM test framework’s performance more concrete, here are some numbers. In each case, the analysis is using the tools of the time.
TL;DR?
Beg, borrow, or re-purpose that old gaming rig running linux+steam.
Analysis: 2026
Things that have changed since 2020
SSDs are common.
CPUs with lots of real and virtual cores are common.
The queue was reimplemented. There’s now a single queue with each worker working on a test independently. Within that test, operations such as VMs, are all serialized. Since a test’s VM boots are no longer run in parallel, a single test run is slower; however the throughput is roughly the same.
Build VMs are assigned $(KVM_WORKERS) CPUs; and make is invoked with
-j ($(KVM_WORKERS).
Test VMs use transient disks (like namespaces, a boot always has a clean disk).
Network interfaces are created directly using low-level IP commands; this is to avoid virsh wanting to constantly play with the firewall.
(Comming soon: replace the thread pool with a process pool.)
Affect of $(KVM_WORKERS) and $(KVM_LOCALDIR)
The full testsuite is run on several pieces of hardware; some looking a little ancient:
-
the first m/c is testing.libreswan.org. It’s ancient but still impressive. It’s numbers are also inflated by having to run an additional 237 WIP tests.
-
the second m/c was cobbled together using a previous-gen gaming CPU (now it’s at least two generations behind)
-
the third and forth m/c really are ancient; and even in their hey-day were low end. It would appear that they are so slow that DH takes so long that the peer times out and/or transmits, leading to false fails.
Note for the following:
-
increasing workers has a diminising return
Which would suggest the bottleneck is else where (mumble something about python threads vs processes).
-
what isn’t captured is that the low-end CPUs struggle to produce consistent results (races in tests)
| year | H/W | GHz | cores | mem | workers | localdir? | time | false fails |
notes |
|---|---|---|---|---|---|---|---|---|---|
| 2011 | Xeon(R) E3-1240 | 3.7 | 4/8 | 64g | 4 | /tmp | 4:30 | 17 | inflated; includes extra 237 WIP tests testing.libreswan.org |
| 2019 | AMD 3950X | 4.1 | 16/32 | 32g | 1 | no | 11:30 | 2 | |
| 2019 | AMD 3950X | 4.1 | 16/32 | 32g | 2 | no | 6:54 | 2 | |
| 2019 | AMD 3950X | 4.1 | 16/32 | 32g | 4 | no | 2:30 | 0 | typical |
| 2019 | AMD 3950X | 4.1 | 16/32 | 32g | 8 | no | 2:16 2:10 |
0 | hmm |
| 2019 | AMD 3950X | 4.1 | 16/32 | 32g | 16 | no | 1:15 | 1 | maxed out; note the diminished return |
| 2012 | CORE(TM) i5-3317U | 1.7 | 2/4 | 4g | 1 | no | 18:59 | 115 | laptop |
| 2012 | CORE(TM) i5-3317U | 1.7 | 2/4 | 4g | 2 | no | 10:04 | 194 | can’t have desktop running! |
| 2017 | Celeron(R) J4105 | 1.5 | 4/4 | 16g | 1 | no | 21:39 | ? | mini-pc |
| 2017 | Celeron(R) J4105 | 1.5 | 4/4 | 16g | 2 | no | ? | ? | mini-pc |
| 2017 | Celeron(R) J4105 | 1.5 | 4/4 | 16g | 4 | no | 7:08 | 298 | + workers==cores |
| 2017 | Celeron(R) J4105 | 1.5 | 4/4 | 16g | 4 | /tmp | 7:10 | 282 | + /tmp |
SystemD’s opinion
[linux@east ~]# systemd-analyze time
Startup finished in 452ms (kernel) + 1.941s (initrd) + 2.538s (userspace) = 4.932s
multi-user.target reached after 1.850s in userspace.
[linux@east ~]# systemd-analyze critical-chain
The time when unit became active or started is printed after the "@" character.
The time the unit took to start is printed after the "+" character.

multi-user.target @1.850s
`-systemd-logind.service @1.779s +69ms
  `-basic.target @1.760s
    `-dbus-broker.service @1.793s +35ms
      `-dbus.socket @1.754s +1ms
        `-sysinit.target @1.753s
          `-systemd-update-utmp.service @1.737s +12ms
            `-auditd.service @1.724s +10ms
              `-systemd-tmpfiles-setup.service @1.637s +85ms
                `-local-fs.target @1.634s
                  `-boot.mount @1.618s +16ms
                    `-dev-vda2.device
[linux@east ~]# systemd-analyze blame
2.523s dev-vda2.device
2.523s dev-disk-by\x2dpath-pci\x2d0000:00:07.0\x2dpart-by\x2duuid-e82d1a7b\x2d854b\x2d47a6\x2d8ba7\x2dc7daf8e933dd.device
2.523s dev-disk-by\x2dpath-virtio\x2dpci\x2d0000:00:07.0\x2dpart2.device
2.523s dev-disk-by\x2dpartuuid-ac590abe\x2db1a8\x2d4702\x2da88a\x2d5e7167d7d6ba.device
2.523s dev-disk-by\x2dpath-pci\x2d0000:00:07.0\x2dpart-by\x2dpartnum-2.device
2.523s dev-disk-by\x2dpath-pci\x2d0000:00:07.0\x2dpart2.device
2.523s dev-disk-by\x2dpath-pci\x2d0000:00:07.0\x2dpart-by\x2dpartuuid-ac590abe\x2db1a8\x2d4702\x2da88a\x2d5e7167d7d6ba.device
2.523s sys-devices-pci0000:00-0000:00:07.0-virtio5-block-vda-vda2.device
2.523s dev-disk-by\x2ddiskseq-1\x2dpart2.device
2.522s dev-disk-by\x2duuid-e82d1a7b\x2d854b\x2d47a6\x2d8ba7\x2dc7daf8e933dd.device
2.519s sys-devices-pci0000:00-0000:00:07.0-virtio5-block-vda-vda1.device
2.519s dev-disk-by\x2dpath-pci\x2d0000:00:07.0\x2dpart-by\x2dpartnum-1.device
2.519s dev-disk-by\x2dpath-virtio\x2dpci\x2d0000:00:07.0\x2dpart1.device
2.519s dev-disk-by\x2dpath-pci\x2d0000:00:07.0\x2dpart-by\x2dpartuuid-3dfdf4fe\x2de8a4\x2d45e8\x2db29d\x2d6eaed467100a.device
2.519s dev-vda1.device
2.519s dev-disk-by\x2dpartuuid-3dfdf4fe\x2de8a4\x2d45e8\x2db29d\x2d6eaed467100a.device
2.519s dev-disk-by\x2dpath-pci\x2d0000:00:07.0\x2dpart1.device
2.519s dev-disk-by\x2ddiskseq-1\x2dpart1.device
2.519s dev-vda.device
2.519s dev-disk-by\x2dpath-virtio\x2dpci\x2d0000:00:07.0.device
2.519s sys-devices-pci0000:00-0000:00:07.0-virtio5-block-vda.device
2.519s dev-disk-by\x2dpath-pci\x2d0000:00:07.0.device
2.519s dev-disk-by\x2ddiskseq-1.device
2.508s dev-disk-by\x2dpath-pci\x2d0000:00:07.0\x2dpart-by\x2dpartuuid-95376c99\x2dc4cb\x2d4fe1\x2daff0\x2dfaeea5efd589.device
2.508s dev-vda3.device
2.508s dev-disk-by\x2dpath-pci\x2d0000:00:07.0\x2dpart-by\x2duuid-3311ec28\x2d9359\x2d42e3\x2d8c07\x2da313ddadb12c.device
2.508s dev-disk-by\x2duuid-3311ec28\x2d9359\x2d42e3\x2d8c07\x2da313ddadb12c.device
2.508s dev-disk-by\x2dpartuuid-95376c99\x2dc4cb\x2d4fe1\x2daff0\x2dfaeea5efd589.device
2.508s sys-devices-pci0000:00-0000:00:07.0-virtio5-block-vda-vda3.device
2.508s dev-disk-by\x2dpath-virtio\x2dpci\x2d0000:00:07.0\x2dpart3.device
2.508s dev-disk-by\x2ddiskseq-1\x2dpart3.device
2.508s dev-disk-by\x2dpath-pci\x2d0000:00:07.0\x2dpart3.device
2.508s dev-disk-by\x2dpath-pci\x2d0000:00:07.0\x2dpart-by\x2dpartnum-3.device
2.497s dev-ttyS3.device
2.497s sys-devices-platform-serial8250-serial8250:0-serial8250:0.3-tty-ttyS3.device
2.461s sys-devices-platform-serial8250-serial8250:0-serial8250:0.2-tty-ttyS2.device
2.461s dev-ttyS2.device
2.447s sys-devices-platform-serial8250-serial8250:0-serial8250:0.1-tty-ttyS1.device
2.447s dev-ttyS1.device
2.393s sys-devices-pnp0-00:00-00:00:0-00:00:0.0-tty-ttyS0.device
2.393s dev-ttyS0.device
2.378s sys-module-configfs.device
1.306s systemd-networkd-wait-online.service
...
Analysis: 2020
Software - what is run by each test
Boot the VMs
Before a test can be run all the VMs are (re)booted. Consequently one obvious way to speed up testing is to reduce the amount of time it takes to boot:
-
make the boot faster - it should be around 1s
-
boot several machines in parallel - however booting is CPU intensive (see below for analysis)
To determine where a VM is spending its time during boot, use
systemd-analyze blame (do several runs, the very first boot does
extra configuration so is always be slower):
$ date ; ./testing/utils/kvmsh.py --boot cold l.east 'systemd-analyze time ; systemd-analyze critical-chain ; systemd-analyze blame'
Mon 10 Aug 2020 09:10:06 PM EDT
virsh 0.00: waiting 20 seconds for domain to shutdown
virsh 0.05: domain shutdown after 0.5 seconds
virsh 0.06: starting domain
virsh 11.07: got login prompt; sending 'root' and waiting 5 seconds for password (or shell) prompt
virsh 11.08: got password prompt after 0.1 seconds; sending 'swan' and waiting 5 seconds for shell prompt
virsh 12.00: we're in after 0.3 seconds!

[root@east ~]# systemd-analyze time ; systemd-analyze critical-chain ; systemd-analyze blame
Startup finished in 1.270s (kernel) + 1.837s (initrd) + 4.448s (userspace) = 7.557s
multi-user.target reached after 4.411s in userspace
The time when unit became active or started is printed after the "@" character.
The time the unit took to start is printed after the "+" character.

multi-user.target @4.411s
└─sshd.service @4.356s +52ms
  └─network.target @4.350s
    └─systemd-networkd.service @1.236s +196ms
      └─systemd-udevd.service @1.003s +229ms
        └─systemd-tmpfiles-setup-dev.service @869ms +102ms
          └─kmod-static-nodes.service @644ms +115ms
            └─systemd-journald.socket
              └─system.slice
                └─-.slice
2.909s systemd-networkd-wait-online.service
 445ms systemd-udev-trigger.service
 443ms systemd-vconsole-setup.service
 229ms systemd-udevd.service
 209ms systemd-journald.service
 196ms systemd-networkd.service
 180ms systemd-tmpfiles-setup.service
 178ms systemd-logind.service
 145ms auditd.service
 138ms source.mount
 124ms testing.mount
 115ms kmod-static-nodes.service
 111ms systemd-journal-flush.service
 110ms tmp.mount
 102ms systemd-tmpfiles-setup-dev.service
  99ms systemd-modules-load.service
  84ms systemd-remount-fs.service
  71ms systemd-random-seed.service
  58ms systemd-sysctl.service
  57ms dbus-broker.service
  52ms sshd.service
  50ms systemd-userdbd.service
  33ms systemd-user-sessions.service
  24ms systemd-fsck-root.service
  23ms dracut-shutdown.service
  21ms systemd-update-utmp.service
  13ms systemd-update-utmp-runlevel.service
   6ms sys-kernel-config.mount
[root@east ~]#
Run the Test Scripts
To establish a baseline, enumcheck-01, which pretty much nothing,
takes ~2s to run the test scripts once things are booted:
w.runner enumcheck-01 32.08/32.05: start running scripts west:west.sh west:final.sh at 2018-10-24 22:00:44.706355
...
w.runner enumcheck-01 34.03/34.00: stop running scripts west:west.sh west:final.sh after 1.5 seconds
everything else is slower.
To get a list of script times:
$ awk '/: stop running scripts/ { print $3, $(NF-1) }' testing/pluto/*/OUTPUT/debug.log | sort -k2nr | head -5
newoe-05-hold-pass 295.6
newoe-04-pass-pass 226.7
ikev2-01-fallback-ikev1 212.5
newoe-10-expire-inactive-ike 205.6
ikev2-32-nat-rw-rekey 205.4
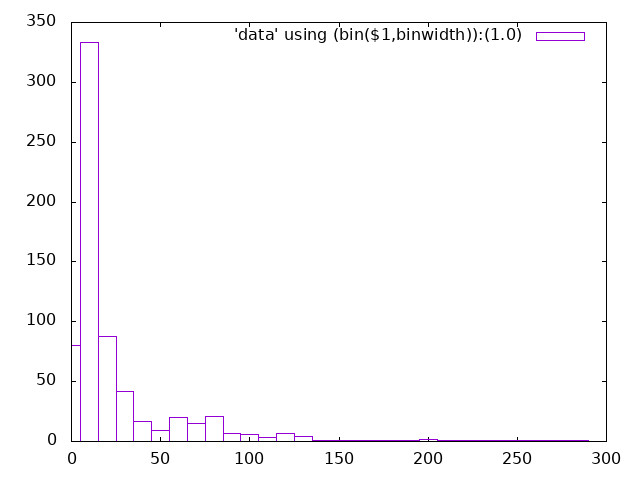
which can then be turned into a histogram:
sleep
ping
timeout
Perform Post-mortem
This seems to be in the noise vis:
m1.runner ipsec-hostkey-ckaid-01 12:44:50.01: start post-mortem ipsec-hostkey-ckaid-01 (test 725 of 739) at 2018-10-25 09:40:49.748041
m1.runner ipsec-hostkey-ckaid-01 12:44:50.03: ****** ipsec-hostkey-ckaid-01 (test 725 of 739) passed ******
m1.runner ipsec-hostkey-ckaid-01 12:44:50.03: stop post-mortem ipsec-hostkey-ckaid-01 (test 725 of 739) after 0.2 seconds
KVM Hardware
What the test runs on
Disk I/O
Something goes here?
Memory
How much is needed?
CPU
Anything Here? Allowing use of HOST’s h/w accelerators?
Docker Hardware
?
Tuning kvm performance
Internally kvmrunner.py has two work queues:
- a pool of reboot threads; each thread reboots one domain at a time
- a pool of test threads; each thread runs one test at a time using domains with a unique prefix
The test threads uses the reboot thread pool as follows:
- get the next test
- submit required domains to reboot pool
- wait for domains to reboot
- run test
- repeat
By adjusting KVM_WORKERS and KVM_PREFIXES it is possible to:
- speed up test runs
- run independent testsuites in parallel
By adjusting KVM_LOCALDIR it is possible to:
- use a faster disk or even tmpfs (on /tmp)
== KVM_WORKERS=… – the number of test domains (machines) booted in parallel ==
Booting the domains is the most CPU intensive part of running a test, and trying to perform too many reboots in parallel will bog down the machine to the point where tests time out and interactive performance becomes hopeless. For this reason a pre-sized pool of reboot threads is used to reboot domains:
- the default is 1 reboot thread limiting things to one domain reboot at a time
- KVM_WORKERS specifies the number of reboot threads, and hence, the reboot parallelism
- increasing this allows more domains to be rebooted in parallel
- however, increasing this consumes more CPU resources
To increase the size of the reboot thread pool set KVM_WORKERS. For instance:
$ grep KVM_WORKERS Makefile.inc.local
KVM_WORKERS=2
$ make kvm-install kvm-test
[...]
runner 0.019: using a pool of 2 worker threads to reboot domains
[...]
runner basic-pluto-01 0.647/0.601: 0 shutdown/reboot jobs ahead of us in the queue
runner basic-pluto-01 0.647/0.601: submitting shutdown jobs for unused domains: road nic north
runner basic-pluto-01 0.653/0.607: submitting boot-and-login jobs for test domains: east west
runner basic-pluto-01 0.654/0.608: submitted 5 jobs; currently 3 jobs pending
[...]
runner basic-pluto-01 28.585/28.539: domains started after 28 seconds
Only if your machine has lots of cores should you consider adjusting this in Makefile.inc.local.
== KVM_PREFIXES=… – create a pool of test domains (machines) ==
Tests spend a lot of their time waiting for timeouts or slow tasks to complete. So that tests can be run in parallel the KVM_PREFIX provides a list of prefixes to add to the host names forming unique domain groups that can each be used to run tests:
- the default is no prefix limiting things to a single global domain pool
- KVM_PREFIXES specifies the domain prefixes to use, and hence, the test parallelism
- increasing this allows more tests to be run in parallel
- however, increasing this consumes more memory and context switch resources
For instance, setting KVM_PREFIXES in Makefile.inc.local to specify a unique set of domains for this directory:
$ grep KVM_PREFIX Makefile.inc.local
KVM_PREFIX=a.
$ make kvm-install
[...]
$ make kvm-test
[...]
runner 0.018: using the serial test processor and domain prefix 'a.'
[...]
a.runner basic-pluto-01 0.574: submitting boot-and-login jobs for test domains: a.west a.east
And setting KVM_PREFIXES in Makefile.inc.local to specify two prefixes and, consequently, run two tests in parallel:
$ grep KVM_PREFIX Makefile.inc.local
KVM_PREFIX=a. b.
$ make kvm-install
[...]
$ make kvm-test
[...]
runner 0.019: using the parallel test processor and domain prefixes ['a.', 'b.']
[...]
b.runner basic-pluto-02 0.632/0.596: submitting boot-and-login jobs for test domains: b.west b.east
[...]
a.runner basic-pluto-01 0.769/0.731: submitting boot-and-login jobs for test domains: a.west a.east
creates and uses two dedicated domain/network groups (a.east …, and b.east …).
Finally, to get rid of all the domains use:
$ make kvm-uninstall
or even:
$ make KVM_PREFIX=b. kvm-uninstall
Two domain groups (e.x., KVM_PREFIX=a. b.) seems to give the best results.
Note that this is still somewhat experimental and has limitations:
- stopping parallel tests requires multiple control-c’s
- since the duplicate domains have the same IP address, things like “ssh
east” don’t apply; use “make kvmsh-
" or "sudo virsh console \<domain" or "./testing/utils/kvmsh.py ".
== KVM_LOCALDIR=/tmp/pool – the directory containing the test domain (machine) disks ==
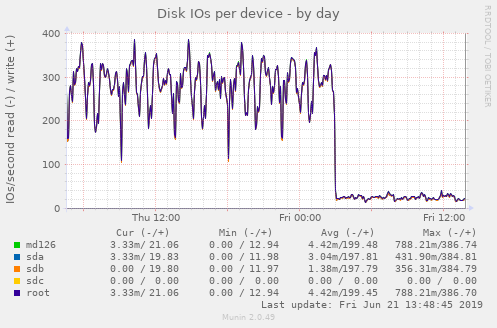
To reduce disk I/O, it is possible to store the test domain disks in ram using tmpfs and /tmp. Here’s a nice graph illustrating what happens when the option is set:
Recommendations
Some Analysis
The test system:
- 4-core 64-bit intel
- plenty of ram
- the file mk/perf.sh
Increasing the number of parallel tests, for a given number of reboot threads:
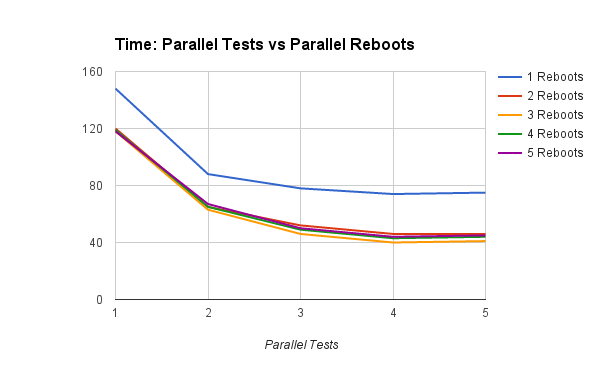
- having #cores/2 reboot threads has the greatest impact
- having more than #cores reboot threads seems to slow things down
Increasing the number of reboots, for a given number of test threads:
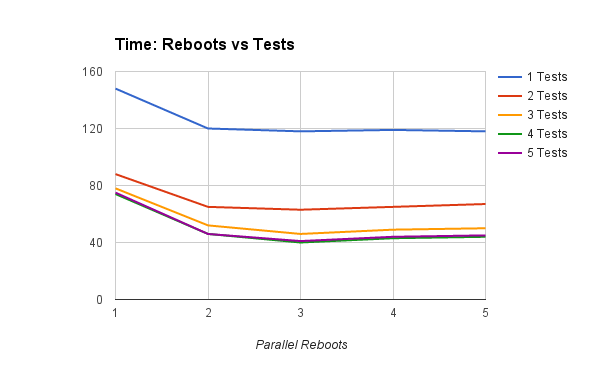
- adding a second test thread has a far greater impact than adding a second reboot thread - contrast top lines
- adding a third and even fourth test thread - i.e., up to #cores - still improves things
Finally here’s some ASCII art showing what happens to the failure rate when the KVM_PREFIX is set so big that the reboot thread pool is kept 100% busy:
                  Fails  Reboots  Time
     ************  127      1     6:35  ****************************************
   **************  135      2     3:33  *********************
  ***************  151      3     3:12  *******************
  ***************  154      4     3:01  ******************
Notice how having more than #cores/2 KVM_WORKERS (here 2) has little benefit and failures edge upwards.
Desktop Development Directory
- reduce build/install time - use only one prefix
- reduce single-test time - boot domains in parallel
- use the non-prefix domains east et.al. so it is easy to access the test domains using tools like ssh
Lets assume 4 cores:
KVM_WORKERS=2
KVM_PREFIX=''
You could also add a second prefix vis:
KVM_PREFIX= '' a.
but that, unfortunately, slows down the the build/install time.
Desktop Baseline Directory
- do not overload the desktop - reduce CPU load by booting sequentially
- reduce total testsuite time - run tests in parallel
- keep separate to development directory above
Lets assume 4 cores
- KVM_WORKERS=1
- KVM_PREFIX= b1. b2.
Dedicated Test Server
- minimize total testsuite time
- maximize CPU use
- assume only testsuite running
Assuming 4 cores:
* KVM_WORKERS=2
* KVM_PREFIX= '' t1. t2. t3.